About Modulus Stock Charts
The Modulus Stock Charts App lets you view stock, commodity, and forex charts and work with technical indicators. Free market data is delayed. New features and real-time data coming soon! Features - Supports chart panels...
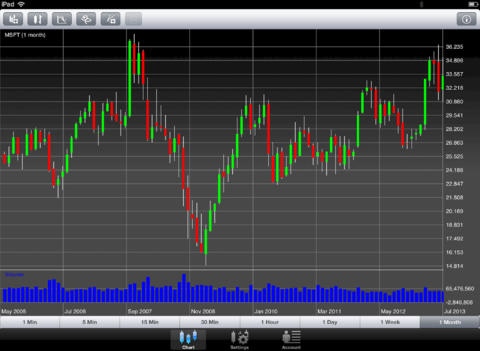
The Modulus Stock Charts App lets you view stock, commodity, and forex charts and work with technical indicators. Free market data is delayed. New features and real-time data coming soon! Features - Supports chart panels with the ability to move/zoom/resize using figure gestures. - Advanced Technical Indicators. - Drawings (i.e. trend lines) with moving/Resizing using finger gestures. - Candlestick, bar, line and histogram chart styles. - All properties (colors, fonts, etc.) are customizable. Included Technical Indicators: Elder Ray Bull Power Elder Ray Bear Power, Elder Force Index, Elder Thermometer, Ehler's Fisher Transform, Keltner Channel, Market Facilitation Index, Schaff Trend Cycle, QStick, Stoller Average Range Channels (STARC), Center Of Gravity, Coppock Curve, Chande Forecast Oscillator, Gopalakrishnan Range Index, Klinger Volume Oscillator, Pretty Good Oscillator, Advanced MACD, RAVI, Random Walk Index, Twiggs Money Flow, Bollinger Bands, Prime Numbers Bands, Chaos Fractal Bands High Low Bands, Moving Average Envelope, Correlation Analysis, High Minus Low, Median Price, Price ROC, Standard Deviation, Typical Price, Volume ROC, Weighted Close, Accumulative Swing Index, Chaikin Money Flow, Commodity Channel Index, Comparative Relative Strength, Mass Index, Money Flow Index, Negative Volume Index, On Balance Volume, Performance Index, Positive Volume Index, Price Volume Trend, Relative Strength Index, Swing Index, Trade Volume Index, Regression R-Squared, Regression Forecast, Regression Slope, Regression Intercept, Time Series Forecast, Aroon, Aroon Oscillator, Chaos Fractal Oscillator, Chaikin Volatility, Historical Volatility, Chande Momentum Oscillator, Detrended Price Oscillator, DI+ DI-, ADX, ADXR, Ease Of Movement, MACD, Momentum, Parabolic SAR, Price Oscillator, Prime Numbers Oscillator, Rainbow Oscillator, Stochastic Oscillator, Stochastic Momentum Index, TRIX, True Range, Ultimate Oscillator, Vertical Horizontal Filter, Volume Oscillator, Williams Accumulation Distribution, Williams %R, Exponential Moving Average, Simple Moving Average, Time Series Moving Average, Triangular Moving Average, Variable Moving Average, VIDYA, Weighted Moving Average, Welles Wilder Smoothing and more.
Requires iOS 6.0 or later. Compatible with iPad.
Previous Versions
Here you can find the changelog of Modulus Stock Charts since it was posted on our website on 2016-11-07 10:09:45.
The latest version is 1.0 and it was updated on 2024-04-22 19:00:33. See below the changes in each version.
Modulus Stock Charts version 1.0
Updated At: 2013-11-14
Disclaimer
Official App Store Link
We do not host Modulus Stock Charts on our servers. We did not scan it for viruses, adware, spyware or other type of malware. This app is hosted by Apple and passed their terms and conditions to be listed there. We recommend caution when installing it.
The App Store link for Modulus Stock Charts is provided to you by apps112.com without any warranties, representations or guarantees of any kind, so access it at your own risk.
If you have questions regarding this particular app contact the publisher directly. For questions about the functionalities of apps112.com contact us.